If you want to contact me, my email is: jimsullivannj@comcast.net
I knew this was a major problem. Now I have been further educated by several Substack sites. They have presented several undeniable statistics which show that the US is headed into strategic decline economically and demographically. The issues I present here are the biggest and most strategic in terms of our future. I do not exaggerate. The basic epistemology (how do we know?) is validated by , stark, undeniable statistics.
Graph 1
This looks like it was originally Statistica sourced. I first saw this on Michael Synder’s Substack – https://theeconomiccollapseblog.com/ – Great Information there.
:

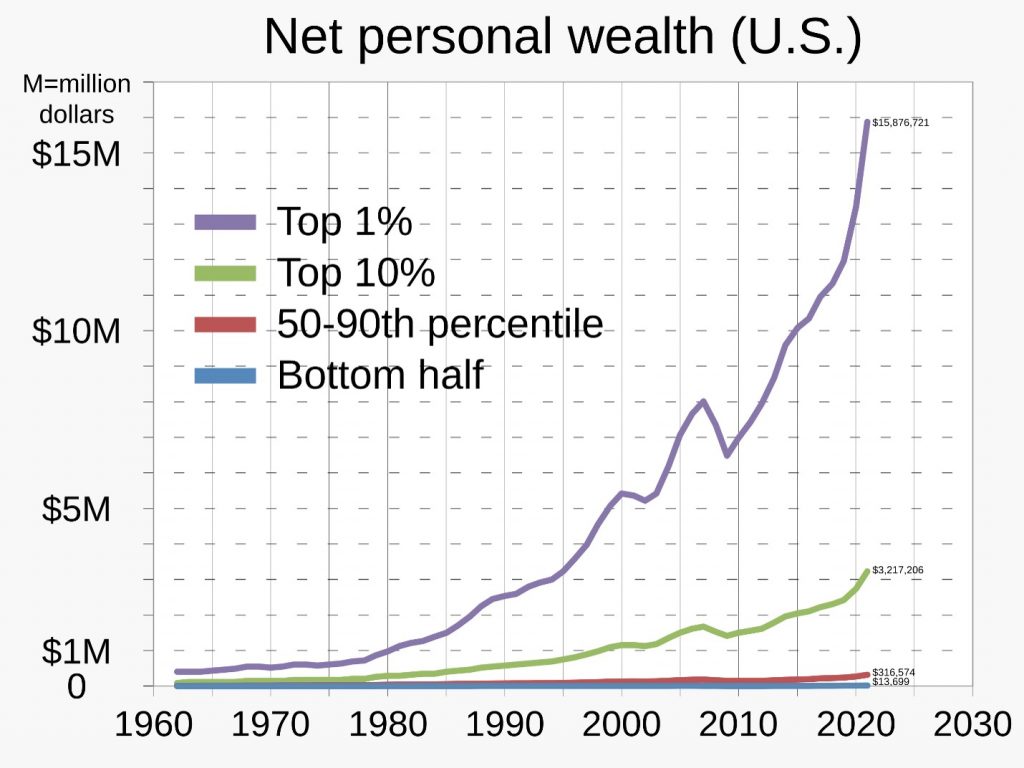
If you even glance at Graph 1, it appears spectacular and; it is. Believe your eyes. Do yourself a favor and look again. The US economy is supposed to be driven in a “virtuous circle”. Consumption (final sales) provides producer-entrepreneurs with more investment money for more production focused on consumer’s growing needs needs. As production/consumption grows, more jobs are created and this increasing income feeds increased buying levels , and so on.
This is what economist call “the Virtuous Circle”. Consumption is a necessary step in the chain. Consumer consumption is 70% of our GDP. The distortion we see locks up this flow. The graph is about Total Wealth. Wealth is not a yearly flow; it is a measure of a cumulative effect for all the years preceding, it is a multi-year dynamic accumulation and acts as a compounding driver. It is still following this trend. Accumulated Asset Value is not production. The highest levels of government present the Stock Markets – exclusively – as the total picture of economic health. This is absurd. Increasing numbers of ordinary people can struggle, go broke and end up homeless regardless of the stock market valuation. The cohort which is the bottom 80% of income is not in stock investment.
The bottom 50% have 1% of investment. The Wealthy live in an isolated sub-culture. They do not want to understand the deterioration in the ability of the masses to hold on to what they have. All forms of debt: Corporate, Government, and private are funded and continue the illusion by debt growth eating away at our children’s and grandchildren’s future). This is not sustainable as Capitalism. It is explained elsewhere by all the realist who predicted past downturns, that the end is near here because there is no way out. This level of debt cannot be repaid nor can it be sustained. The debt is in the hundreds of thousands for each tax paying unit. This is true in the US and many other nations. There will be inflation, stagflation, and finally collapse. After this, a new level of liquidity crisis and we will be stuck in deflation. This is a classic pattern repeated in history.
The effects of Wealth inequality also appears in big money contribution dominating in our election cycles and government administration. Just one example: consider what it did to our handling the Covid Pandemic. “it’s the science” ? More than 2 dozen US agencies knew that it was from the Wuhan lab immediately. The Lancet, a top level medical science publication, originally stated the truth. They were persuaded by Fauchi to reverse and received millions in subsidies after they did. See any pattern? I knew Covid’s obvious origin and how honest researchers knew it was gain of function; I knew about cleavage sites, AE2 and all that. It was known in 2 months that it is like a mild flu for children. Later it was known that it was causing an elevation in miscarriages. This was discussed with Fauchi and dismissed. States like Florida and entire countries like Sweden knew the draconian measures were based on many lies. They had the same outcomes by ignoring those measures. Pharmaceuticals are the biggest contributor of corporate donations to election donations. Money? The RNA treatment (Calling it a vaccine is the initial lie). could not be approved if there was a safe alternative by law. This was the reason for the great distortion. An alternative treatment: Ivermectin – used and proven, like aspirin, in the rest of the world for decades, was widely propaganisized as toxic horse medicine by decree. Excess lives were lost. There was no real science, only self- serving distortion. At this point, the only publicly stated justification for any government action is “the broad common good”. In practice, this is a pose. Our democracy by representation does not function under these conditions. This is another effect of The Wealth Gap.
If you think this is dramatic or over-dramatic watch this You Tube video that focuses on what Americans think the Wealth Distribution is like. It is 13 years old so it is significantly worse. It proves the public has no clue. This is another reason representative government fails.
Graph 1 and the You Tube was like a slap in the back of my head when i first saw it. It was a deserved slap because we are kept so dumb. It gets worse:
Wait to you hear the bad news:
Graph 2 This looks like Statistica sourced. I first saw this By Cynical Publius
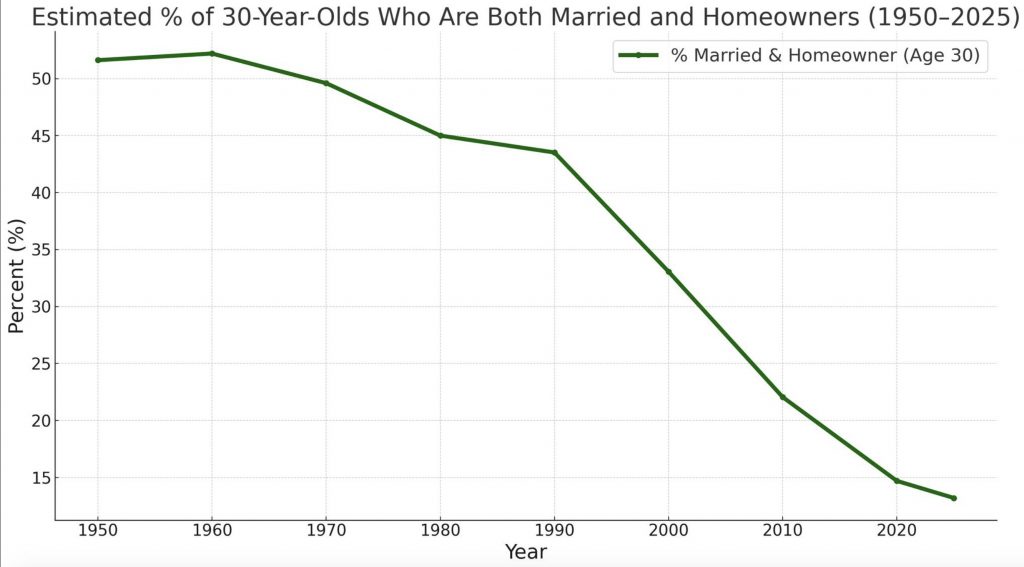
Graph 2 is worse in its strategic implications because it shows the long-term future of our country. Only families provide a future for the United States in the long run. Can you think of another model? What the graph shows about family formation reveals an alarming problem. At present it seems, the news analysts have no idea why so many people are voting for socialism. As the reality unfolds, this will drive the worst instincts: it is an emotional driver of detachment, or anger, and a feeling that we should let it all crash. This could be addressed by an honest disclosure to everyone by the financial mass media and politicians but that would interrupt the party with all its excesses. Th e default is to desperately insist everything is great financially. This leaves the public to react to a growing sense of dissonance that must give way to a growing sense of helplessness as reality imposes, to a sense of alarm, even despair, and at the later stage – panic.
I am in my 80’s and I knew for decades that the younger generations was getting screwed. They can not buy a house or some other equivalent. Nor, if you are responsible, to have children. The social contract that I faced and drove my parents was so much more inviting and reachable. The graph is stark in proving this. The present rate of formation of a household and raising children by 30 years of age is 13% in 2024. This is 1/4 of the 53% in 1950 which was normal and viable. Statistics! No wonder the ambition, the drive and the dream is not the same for the next generations. You don’t have to be a sociologist or a demographer to understand the implications. Analysis comparing age cohorts that assess or compare blame and judgement are nonsense. Also, to assess logically and mathematically you should know that the Reproduction rate has to be 2.1 for every couple to keep the population even. This essay is about the U.S. but it is of note that this is happening all over many countries and in Asia. I asked co-pilot AI about our reproduction rate.
Co-Pilot: “Short answer: The current U.S. population reproduction rate (NRR) is about 0.78, far below the replacement equilibrium level of 1.0 and consistent with a total fertility rate (TFR) of ~1.63, which is well below the 2.1 children per woman needed for long‑term population stability.”
The 1.63 statistic is the shortfall compared to the 2.1 minimum needed for stability. The momentum in the decline is judged irreversible. . We may be on our way out. Don’t blame me. I am just the messenger. Knowing will not make it any worse. For you: knowing could allow planning to minimize damage. This i s also the story for China, South Korea and many other countries.
How do you feel about top business leaders, our two parties and our media paying no attention to these issues?
It is fair to ask me or anyone “So what is the solution” One big item is to overturn the Supreme Court Decision to allow Corporations to donate billions of dollars tp politicians through many avenues. It was supported by the right to free speech on the basis that corporations are people. I worked for some of the biggest corporations in the US and I can tell you this is wrong on many levels. Ever hear of a drafted soldier facing death in combat turn to his corporation companion to share his fate? When AT&T had a 100’s of thousands of employees did they have any say over the Board’s positions. The ratio of board members to employees would be 10,100 to 1. The employees could not stand up on a soap box in their cubicle and give an impassioned speech to effect the top dozen decision makers. The court case must have been presented badly. The right of free speech is an individual’s right. There are many more areas such as public education in the mechanisms that have gone bad by the effects of big money. Look up this headline :
“MF Global Bankruptcy & Jon Corzine’s TRS: $1.6B Went Missing”
There was criminal misuse of money. A perp-walk would have done wonders. The same applies to the 2008 meltdown. The shadow of big money and political power insures immunity. Does the public know how President Clinton pushed through legislation that helped set up the 2008 financial crisis? Is either mainstream party addressing this problem at this time?
Recent Comments